Strategic Illustration, Visual Summaries, and Videos
Custom Visuals for Your Next Meeting, Presentation, or Communication
Do you need to share your story in a way that connects with your audience? Do you need to get people inside of your organization excited about a strategy or program or initiative? Are you overusing PowerPoint as a presentation method? Do you ever need to “paint a picture from data”?
Strategic illustration will help!
Strategic illustration helps you visualize and communicate various aspects of your organization and share important ideas and content with others through digital illustrations and infographics, visual bios, large-scale strategic illustrations, live visual summaries, visual templates and learning tools, and animated explainer videos. To create a strategic illustration, I synthesize information from one more sources and filter it down to its essence in the form of key messages, words, and images. Strategic illustrations often follow an organizational visual mapping session or a personal and professional visual mapping session, and can also be created from presentations, reports, data, videos, panel discussions, conversations, and many other sources of content. This type of visual communication effectively uses images to persuade, inform, enlighten, and entertain an observing audience about information, content, data, products, ideas, and key messages.
Strategic illustration allows organizations to:
Visualize and internalize important, strategic content
Share various aspects of their organizations in engaging, visual ways
Synthesize and simplify large amounts of [often] complex information and data and communicate it in a way that makes it accessible, understandable, digestible, and useful – in one place, in a visual way
Share their story with others
Strategic illustration is ideal for visualizing and sharing:
Synthesized information from meetings, working sessions, and focus groups
Meeting preparation materials and handouts
Pitches, keynote speeches, and presentations
Town halls and all-hands meetings
Organizational history, mission and vision, values and culture
Strategic plans, project plans, goals, and action plans
Processes, systems, models, and approaches
Business models and business planning activities
Change management strategies and plans
Lessons learned and postmortems
Annual reports, research findings, and survey results
Annual benefits enrollment information
Leadership development programs
Learning and development and online / virtual training / website content
Customer personas and information about products and services
Christy is a genius at taking numerous disparate thoughts, ideas, and strategic inputs and boiling them down to their essence and then representing them visually in a simple, connected, compelling and brilliant manner.
Mindi Sullivan, Senior Director, Global People Experience, d-wise
Check out some of my strategic illustrations below:
Hand-Drawn Strategic Illustrations, Infographics, and Presentations (Digital)
Meals on Wheels of Orange County NC (formerly Chapel Hill Carrboro Meals on Wheels) recently worked to create a five-year strategic plan, which they wished to share with their supporters, volunteers, and those they serve in a creative and engaging way. I visualized the strategy, then drew the content in separate layers. The executive director was then able to present the strategy one step at a time during a fundraising event. Afterward, I worked with the executive director to record her script, and then used the visual of the strategic plan to create an animated video for the Meals on Wheels website. (Scroll down to the Animated Explainer Videos section at the bottom of this page to see the video version.)As part of an Appalachia Funders Network Strategic Planning Retreat, I captured notes from a panel discussion and retrospective on the history of the network and its path forward. I worked with the executive director to identify themes from the discussion, then represented those themes with supporting statements, quotes, and illustrations. I added quotes from another activity, “Six Word Stories about AFN,” around the border of the visual.After Leadership NC’s Annual Forum 2022, I synthesized the information from the conference presentations and the facilitator’s activities to create a polished visual on my iPad.I partnered with Oakley & Associates Consulting to create a three-part visual presentation on Creating Mental Health Informed Teams. Below is the first part of the three-part presentation. I drew the content in separate layers, and during the presentation I revealed the individual layers one at a time as my partner presented the information. After the presentation, the three completed visuals were used as infographics to communicate the information to a broader audience.I partnered with Oakley & Associates Consulting to create a three-part visual presentation on Creating Mental Health Informed Teams. Below is the second part of the three-part presentation. I drew the content in separate layers, and during the presentation I revealed the individual layers one at a time as my partner presented the information. After the presentation, the three completed visuals were used as infographics to communicate the information to a broader audience.I partnered with Oakley & Associates Consulting to create a three-part visual presentation on Creating Mental Health Informed Teams. Below is the third part of the three-part presentation. I drew the content in separate layers, and during the presentation I revealed the individual layers one at a time as my partner presented the information. After the presentation, the three completed visuals were used as infographics to communicate the information to a broader audience.After an “Annual State of the Community” report from a local Chamber of Commerce, I created a visual summary of the report’s 10 key findings.I worked with the Community Employment Collaboration, a network of community, post-secondary schools and government employment offices in Newfoundland and Labrador, Canada, to synthesize and present the high-level findings from a research study that shows the impact of social and experiential learning and how taking part in community-based research has transformed the way Career Development Practitioners do their work.I worked with the founder of ADHD Lifestyle Magazine to create a visual representation to accompany an article in the premiere issue of ADHD Lifestyle Magazine.I worked with a university to develop, describe, and illustrate their “Discover Your Passions” process, which is part of their “Major and a Mission” initiative for the university’s students. I also created an accompanying visual workbook that takes students through each step of the “Discover Your Passions” process below.I created this infographic to illustrate the strategic partnership between two entrepreneurs.Amy Eller of Amy Eller Marketing works with non-profits, business owners, and entrepreneurs who are working to make the world a better place for us all. As she partners with her clients to build their brands, she helps them develop a solid understanding of where they are now and where they want to be. She starts every new client with her “Roadmapping” session. I partnered with her to “deconstruct” her roadmapping process, map out the various steps and associated activities, and create a visual representation of the process to share with her clients.I created my own strategic illustration, “Turn Ideas Into Action,” to help me explain my VizualWorx process to my clients.During a company’s quarterly executive offsite meeting, one of the executives presented a strategy for communication called “Yes, and…”. I captured and synthesized the information, and then created a visual to represent and explain the process to the entire company. The company had the visual printed and framed for all employees to sit on their desks as a reminder to use “Yes, and…” rather than “No, but…” when communicating with each other.
This is a summary of a quarterly executive strategy meeting. The visual summary, which captures the essence of the meeting as well as key messages and action items, was shared with the entire organization after the meeting. When the executives communicated to the organization using this visual, many of the employees responded that they felt like they were present in the unfolding discussions in a way they’ve never been able to do.
I created this infographic to illustrate the relationships between users, courses, groups, and branches for a client’s new learning management system (LMS).I worked with a client to create visual meeting notes from a Zoom meeting to distribute to the larger staff.After working with a client on potential structures for a one-pager document for her clients, I created these visual notes for her to share with her staff.I created this “as-is” and “to-be” visual to illustrate the current state of an organization’s training department and the envisioned and transformed future learning and development function.
Visual Bios and Personal Summaries
I created this is a visual bio for Lauren Erickson, CFP®, Partner and Financial Advisor, of Erickson Advisors.I created my own visual bio to capture and share my journey to the field of visual practice.I created this visual summary for a client to reflect on her past, take stock of her present, and envision her future.
I worked with a university to develop, describe, and illustrate their “Discover Your Passions” process, which is part of their “Major and a Mission” initiative for the university’s students. I also created an accompanying visual workbook that takes students through each step of the “Discover Your Passions” process below. This is the large-scale illustration I created prior to creating the digital version (above) and visual workbook.I worked with an organization to illustrate the tactics for their corporate university’s learning strategy by job function.I worked with a client to envision her firm’s future and work through the success factors needed to realize her vision. She then used this visual to communicate her vision and its details to her team.I worked with a corporate client to create this large-scale visual of each function’s fourth quarter goals / tasks by month. This is my first [and large-scale] version of my personal visual bio. Scroll up for the later, digitally-created version.
Live Visual Summaries / Graphic Recording
During an organization’s executive offsite meeting, I captured key messages and “the essence” of the meeting. When the visual summary was shared with the larger, mostly remote workforce, many of the employees responded that they felt like they were present in the unfolding discussions in a way they had never been able to do.Central Carolina Women in Business asked Lauren Erickson, CFP®, of Erickson Advisors to deliver a keynote speech at their annual luncheon, and asked that I do a live graphic recording of the presentation. Lauren chose the topic “From Loose Ends to New Year Successes,” and discussed 10 financial actions to take before April 2019. I created a live visual summary of the 10 actions as Lauren spoke.Leigh Kempf, CFP®, Vice President and Wealth Management Advisor of KG & Associates (Merrill Lynch), hosted a “Picture Your Prosperity” workshop for a group of clients. The workshop was delivered by Ellen Rogin, New York Times best-selling author of “Picture Your Prosperity.” During the event, I created a live visual summary of the key points and insights from Ellen’s presentation.The Health Collaborative, a cross-sector group of residents who work together to improve the health and well-being of the Dan River Region, hosted its 2019 Health Summit in Danville, VA. The event featured a keynote speaker, a celebration of five years of community impact, and interactive “table talks” aimed at generating and presenting ideas around how to support the building of a healthy, vibrant community. I created a live, visual summary throughout the event.At an annual meeting, a local chamber of commerce asked participants to work through five key questions. I captured each table’s responses as they reported out. The result is a compilation that gets at the heart of “The Why of the Chamber.” After co-facilitating a teambuilding activity at a local organization, I visually captured the debrief and discussion of the participants’ experiences.I created this live visual summary during a December 2019 meeting of the “Ladies Tech Lunch” group.I created this live visual summary of a presentation given by Amy Russo, owner of Fit4Mom®, during an event hosted by Lauren Erickson, CFP®, Partner and Financial Advisor at Erickson Advisors.
Visual Templates
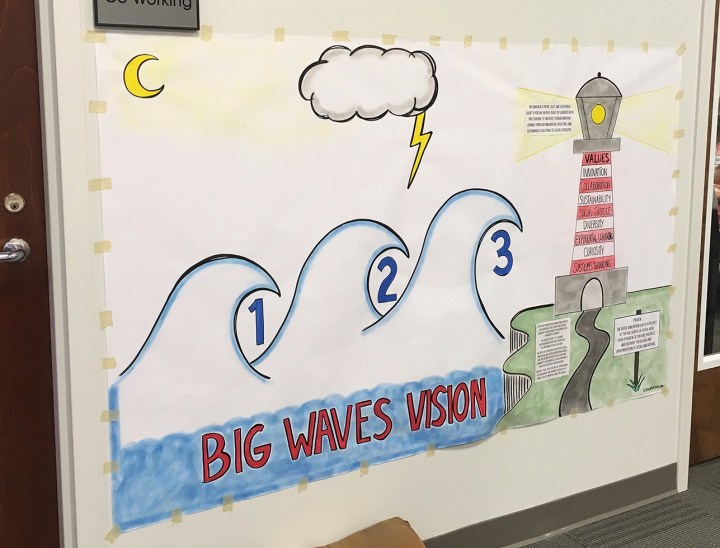
I worked with the HR function in an organization to create this “Employee Learning Plan and Performance” template for employees to use in their yearly development plans and annual reviews.I created this visual template to accompany the exercises in the Designing Your Life book Chapter 2, “Building a Compass.”This is one of seven large-scale visual templates I created to help an organization illustrate and track progress toward corporate goals. The templates were display around the offices of the organization, and the hikers, which displayed cascading goals and tasks, were moved up the path as the organization made progress toward each goal.This is a Context Map template that I created for a strategic visioning session at a local university. You can see the completed template on the Organizational Visual Mapping and Brainstorming page.This is a SPOT (Strengths, Problems, Opportunities, and Threats) template that I created for a strategic visioning session at a local university. You can see the completed template on the Organizational Visual Mapping and Brainstorming page.This is a Big Waves Vision template that I created for a strategic visioning session at a local university. You can see the completed template on the Organizational Visual Mapping and Brainstorming page.I created this template based on “the pitch” model from Dan Roam’s book “Show and Tell: How Everybody Can Make Extraordinary Presentations.” I created this visual template to accompany the document my SCORE mentor uses with his clients when working through their service descriptions.
Animated Explainer Videos
I worked with Terry Carroll, a physicist and Founder, Designer, and CEO of SunCatcher Passive Solar Greenhouses to tell their unique story in a timeless way so potential customers would understand how they could help them.
During COVID-19, I worked with Meals on Wheels of Orange County NC to visually tell our story and also say “thank you” to all those in the community who helped them sustain their service.
During COVID-19, I partnered with psychologist Dr. Danielle Oakley of Oakley & Associates Consulting to create a series of videos to provide information and support for healthcare workers. This is the first of three videos.
During COVID-19, I partnered with psychologist Dr. Danielle Oakley of Oakley & Associates Consulting to create a series of videos to provide information and support for healthcare workers. This is the second of three videos.
During COVID-19, I partnered with psychologist Dr. Danielle Oakley of Oakley & Associates Consulting to create a series of videos to provide information and support for healthcare workers. This is the third of three videos.
I partnered with the kindergarten team from Tuttle Elementary to create this video to help parents and their young children get ready for kindergarten!
Meals on Wheels of Orange County NC (formerly Chapel Hill Carrboro Meals on Wheels) recently worked to create a five-year strategic plan, which they wished to share with their supporters, volunteers, and those they serve in a creative and engaging way. I visualized the strategy, then drew the content in separate layers. The executive director was then able to present the strategy one step at a time during a fundraising event. Afterward, I worked with the executive director to record her script, and then used the visual of the strategic plan to create an animated video for the Meals on Wheels website.
What My Clients Are Saying
Christy is a genius at taking numerous disparate thoughts, ideas, and strategic inputs and boiling them down to their essence and then representing them visually in a simple, connected, compelling and brilliant manner. One of the tremendous, unexpected outcomes of having the essence of our strategic executive meetings captured in a visual is one of inclusion with our larger, and often remote, workforce. When we communicated to the organization using the visuals created by Christy, many of our employees responded indicating that they felt like they were present in the unfolding discussions in a way they’ve never been able to do. Our workforce was able to rapidly understand the communications because the visuals capture so many key points and messages in a way that only using words simply can’t do.I would strongly recommend Christy’s visual genius to any organization looking to improve and/or enhance the overall achievement of desired business outcomes through more effective communications, strategic planning, execution, and inclusion.
Mindi Sullivan, Senior Director, Global People Experience, d-wise
Meals on Wheels Orange County, NC has had the opportunity to work with Christy multiple times over the past several years. We turned to Christy during COVID to harness her creativity to enable us to visually tell our story and as a thank you to all those in the community who helped us sustain our service. The sketch video was a big hit with our fundraiser participants, donors, and website visitors. Christy has been a thoughtful partner and collaborator helping MOWOCNC to better focus our services in support of our mission and to creatively capture and share our story. We look forward to working with Christy and using her talents once again as we work our way through, and hopefully past, COVID, and determine how MOWOCNC can continue to best serve its clients and the broader community.
Rachel Bearman, Executive Director, Meals on Wheels Orange County , NC
What I appreciate about working with Christy is the ability to process and synthesize large amounts of data into a coherent visual story. The image she created was a huge highlight of a conference session on how practitioners learn.
Elayne Greeley, Partnership Broker, Community Employment Collaboration, Newfoundland and Labrador, Canada
As soon as I saw one of Christy’s visuals I knew this was something I wanted to experience! The whole process was a facilitation of communication that put our firm on a journey of growth. It’s some of the most worthwhile time and money we have spent.
Lauren Erickson, CFP® CSRIC™, Erickson Advisors
It was an absolute pleasure to work with Christy in developing our SunCatcher Explainer Video! SunCatcher wanted someone to tell our unique story in a timeless way so potential customers would understand how we can help them. Christy quickly grasped what we needed (sometimes better than we did) and then proceeded to ask for input and made a variety of suggestions based on that input as we honed in on exactly what we wanted. We wrote the script together, then she worked her magic to create a compelling video using a storyboard with just the right images and background music. Christy was able to take an involved story and make a number of interrelated points about our product while capturing the viewer’s attention.
Christy creates exceptional, high quality, professional products and has an eye for detail with a relaxed, comfortable approach. I must confess on a number of occasions SunCatcher has been approached by customers not to learn more about our products but wanting to know more about our explainer video and who created it!
Terry Carroll, Physicist, Founder, Designer and CEO, SunCatcher Passive Solar Greenhouses
The visual illustrations Christy provided for a presentation to a Division I athletic department helped participants engage and make a deeper emotional connection with the content.